Technical Application Parameters of UAV in Tobacco Planting — Growth Vigor, Maturity, Pest and Disease Identification
In mid-July 2024, at a tobacco demonstration base in Hubei Province, the flue-cured tobacco was in its most vigorous expansion stage. The afternoon sun was somewhat dazzling, and the air was filled with the scent of soil and rich leaves. I stood at the edge of the terraced fields, holding a remote controller, staring at the flying DJI Mavic 3M (Mavic 3 Multispectral) on the screen. The traditional way of field inspection — walking through the fields with a notebook and camera — was not only dreadfully inefficient but, more critically, it was extremely difficult for the human eye to capture those subtle physiological changes amidst the vast expanse of green.
What we were looking for was not the visible "yellow" or "green", but the spectral signals hidden within the microscopic structure of the leaves.
I. Growth Vigor Monitoring: Breaking Out of the NDVI "Saturation Trap"
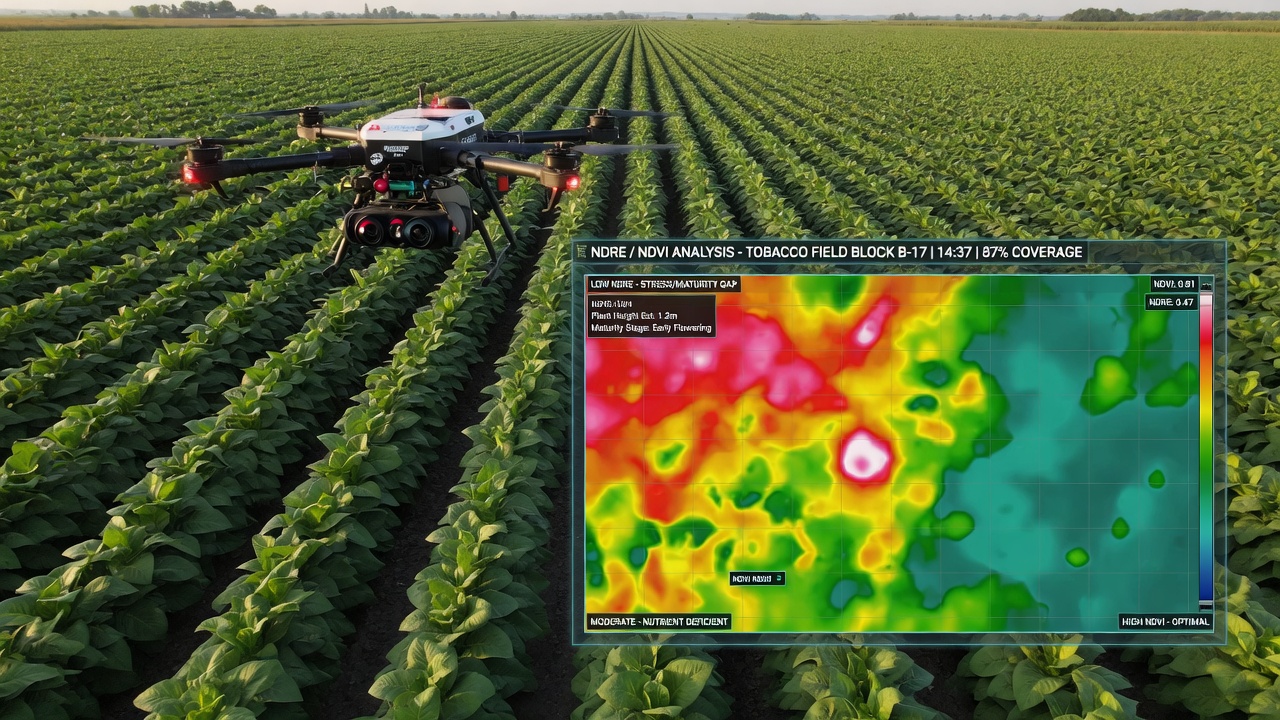
In the early stages of tobacco planting, we were accustomed to using NDVI (Normalized Difference Vegetation Index) to assess growth vigor. The formula is simple: $(NIR - Red) / (NIR + Red)$. During the seedling stage and early growth period, NDVI indeed worked very well — it could clearly outline plant distribution and identify weak seedling areas with retarded growth.
However, as the plants entered the peak stage, tobacco leaves expanded rapidly and the canopy became extremely dense. I encountered a classic engineering problem: NDVI saturation. When vegetation coverage reaches a certain level, NDVI values quickly tend toward 0.8 or 0.9, followed by a prolonged "plateau phase". Even though the biomass of the tobacco plants continued to increase, the NDVI values barely changed. At this point, if you rely solely on NDVI to guide fertilization, you would misjudge areas with good growth vigor as "growth stagnant", leading to over-fertilization.
In this operation, I switched the focus to NDRE (Normalized Difference Red Edge Index). Because tobacco leaves are extremely sensitive to the red edge band (Red Edge, approximately 730 nm) during the maturation period, NDRE can effectively penetrate the dense canopy, reflecting the true distribution of chlorophyll.
Practical parameter records:
- Flight altitude: 30 m (to ensure efficiency while achieving a Ground Sampling Distance GSD of approximately 1.6 cm/pixel).
- Overlap rate: Forward 80%, side 75% (high overlap rate is key to ensuring seamless, high-precision orthophoto mosaic generation).
- Flight speed: 3.5 m/s.
- Time window: 10:30 AM to 1:30 PM (avoiding morning dew interference and insufficient evening light, ensuring radiation stability of spectral data).
Through the 5 monochromatic band data collected by the M3M, combined with processing by DJI Terra, the NDRE map we generated clearly showed the differences in nutrient distribution across the field: those areas with abnormally decreased red edge reflectance were precisely where variable-rate nitrogen supplementation was needed.
II. Maturity Assessment: Finding the "Blue Shift" Signal of the Red Edge
If growth vigor monitoring is about "quantity", then maturity assessment is about "quality". For tobacco farmers, knowing when to harvest is the key to determining tobacco leaf quality (such as sugar-alkali ratio and moisture content).
The traditional visual method — observing leaf color lightening and veins turning white — is highly subjective. In practice, different workers often have different judgment standards, which directly leads to chaotic harvest timing.
What we seek is the "red edge shift" in spectral characteristics. As tobacco leaves mature, chlorophyll content drops sharply, causing significant changes in the reflection characteristics of leaves in the red edge region (680–750 nm). Through high-precision multispectral sensors, we can capture this subtle "blue shift" phenomenon.
Key technical parameters and thresholds:
In our local calibration model, RVI (1100, 660) (Ratio Vegetation Index) is the most reliable indicator.
- Immature stage: RVI > 3.75, leaves appear dark green, photosynthesis is vigorous.
- Optimal maturity stage (golden window): RVI is between 2.81–3.47. At this time, the red edge position is stable near 693–695 nm.
- Over-mature stage: RVI < 2.72, leaves begin to show obvious yellowing, the red edge position shifts toward shorter wavelengths, dropping to approximately 688 nm.
In a monitoring task focused on the maturity of middle leaves, we found that a tobacco field that originally appeared uniform in color, when analyzed through the RVI spatial distribution map, actually showed obvious "patchy" maturity differences. Some areas, due to poor drainage causing water stress, had entered the over-mature stage prematurely. This kind of data could never be obtained through manual field inspection on such a large scale.
III. Pest and Disease Identification: Early Warning Before the Naked Eye Can Detect
In tobacco cultivation, wilt disease and powdery mildew are persistent threats. Waiting until the leaves show obvious lesions or wilting often means the optimal prevention and treatment window has already passed.
The core logic of UAV monitoring lies in "difference analysis". By comparing NDVI or NDRE index changes at different time points (such as one week ago vs now), or combining high-resolution RGB imagery for texture analysis, we can identify "early warning zones" where spectral characteristics show abnormal fluctuations.
Real challenges encountered:
In the hilly terrain of Hubei, large topographical variations lead to severe shadow problems. Under side lighting, shadows in the field cause drastic fluctuations in spectral reflectance, which can easily be misidentified as disease areas. To solve this problem, we must mandate the use of equipment with built-in sunlight sensors for radiometric calibration and include more Ground Control Points (GCP) in the flight path to ensure the physical meaning of imagery is consistent under different lighting conditions.
Furthermore, distinguishing "nutrient deficiency" from "early-stage disease" is also a challenge. Both appear similar on NDVI indices. Our experience is to combine red edge slope and texture features. Diseases typically manifest as point-like or irregularly spreading patches, while nutrient deficiencies tend to show more regular strip-like or regional distributions associated with soil fertility patterns.
IV. Harvest Decision-making: The Last Step from Data to Instruction
The ultimate goal of monitoring data is not to generate beautiful charts, but to guide harvesting.
Tobacco harvesting is a layered, batch-by-batch process. We need to start from the lower leaves (bottom leaves) and gradually move toward the upper leaves (top leaves). Based on the "maturity spatial distribution map" generated by UAVs, we can formulate extremely precise harvesting instructions.
Harvest guidance process:
- Generate prescription map: Convert RVI and red edge position parameters into a "harvest priority map".
- Layered decision-making:
- First priority (middle leaf optimal maturity zone): RVI around 3.0, red edge position 694 nm. This portion has the most stable quality and should be scheduled for immediate manual or mechanical harvesting.
- Second priority (top leaf early warning zone): Identify top leaves that have entered the optimal maturity stage and plan the harvesting route in advance.
- Avoidance zone (over-mature/immature zone): For over-mature areas with RVI < 2.7, harvest as soon as possible to prevent shattering; for immature areas with RVI > 3.7, continue field observation.
- Path optimization: Combine terrain data to guide harvesting personnel to first enter areas with the highest maturity and easiest access, maximizing efficiency.
Through this approach, we have successfully transformed tobacco harvesting from a traditional model of "relying on the weather and guessing from experience" into a precision operation model of "driven by data and guided by parameters". This is not just an improvement in efficiency, but a scientific guarantee of tobacco quality.
Traditional Field Inspection
Naked eye judgment, highly subjective, low efficiency, difficult to scale
UAV Field Inspection
Spectral data-driven, objective quantification, scalable standardized operation